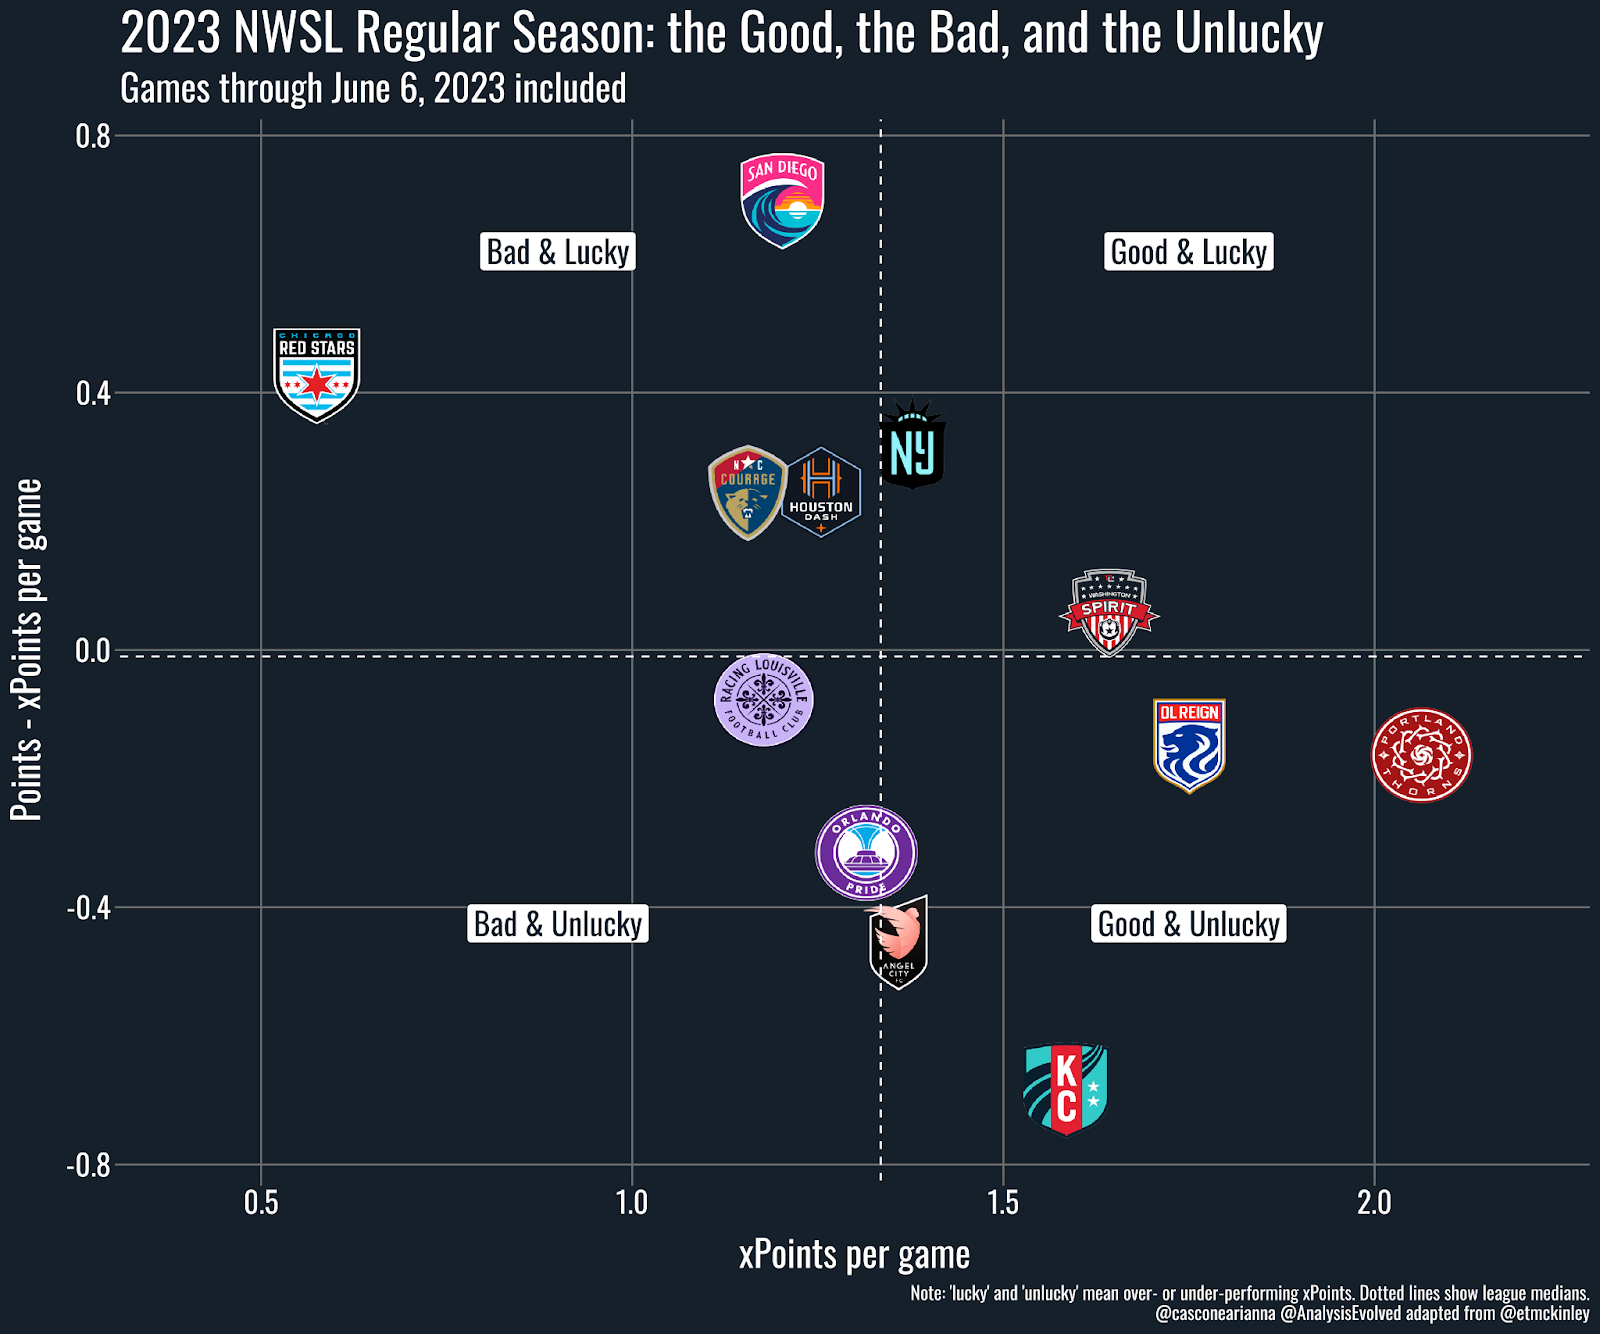
We’re just under halfway through the 2023 NWSL regular season, and each team has 10 games under their belts. With so much movement up and down the NWSL standings through the first half of the season, now’s a good time to revisit the Good-Bad/Lucky-Unlucky visualization from last season.
As a reminder, this is an American Soccer Analysis gem, created by Eliot McKinley.
We first determine whether teams have been ‘good’ or ‘bad’ by comparing their expected points per game to the league median. Simple enough, right? Then, we determine how ‘lucky’ a team has been by looking at the difference in points and expected points per game for every single team. ‘Lucky’ teams over-perform their expected points, while ‘unlucky’ teams under-perform them.
Here’s the 2023 spread!

Let’s dig into the two teams that jump out from each quadrant, starting with those that have been the best and luckiest.


